
Explore New York City’s Emerging Three-Party System
An interactive dashboard shows how fusion voting and political fragmentation are reshaping city elections.

New York City’s recent council elections suggest a de facto three-party system, driven by cross-endorsements and growing competition on the left and right, that is straining rules built for two parties.
On the ballot, the fragmentation shows up as distinct blocs: Democratic–Working Families candidates, regular Democrats, and Republican–Conservative tickets, along with smaller parties that can still win an occasional seat. In practice, voters are not choosing between just two parties but among overlapping coalitions. (Check out the dashboard here.)
Fragmentation is greater than what the city’s rules predict.
Efforts to measure fragmentation often start with the “effective” number of electoral parties (ENEP). Political scientists use this index to count parties while accounting for their sizes. Consider three with 52, 45, and 3 percent of votes, respectively. Should we call this a three-party system, or would it be more accurate to say “a little more than two”? Taking the inverse of the sum of the parties’ squared vote proportions gives us 2.11.
ENEP in the last council election was 3.3. This is based on votes for parties as they appear in the data. So, if a candidate appeared with two parties’ endorsements, I treat that endorsement combination as a party of its own. The largest party by votes was Democratic-Working Families (39%), followed by regular Democrats (35%), then Republican-Conservatives (14%). There are other parties in the data, two of which won one seat each.
Another way to look at the data is to treat votes for fusion candidates as votes for their major-party endorsers. For example, Democratic-Working Families votes count toward Democrats, and Republican-Conservative votes go into the Republican column. Computing ENEP in this way gets us to 1.6.
Which measure is better?
Some might say the former because it contains information on how parties presented candidates to voters. The New Republic recently described Working Families as “the third party that’s pushing the Democrats left.”
Another approach is to ask what figure the current electoral system is expected to produce. The seat-product model (SPM) calculates this expectation on the basis of council size (51 seats) and the average number of seats per district (one). That figure is 2.7, closer to the observed ENEP. This is not surprising because the SPM assumes voters act on how parties present themselves. Yet 3.3 is still much greater than 2.7.
Fragmentation extends into the City Council as well. There, the effective number of legislative parties is 2.6 versus an expected 1.9.
Disproportionality is considerable as well.
The Gallagher index summarizes differences between parties’ shares of votes and seats on a scale of 0-100. Its value at the last council election was 7.3 percent. Globally, this is moderate. The highest values concentrate in countries with very small parliaments or where many minor parties have been running under first-past-the-post. For the U.S., however, 7.3 percent is appreciable. The index value was 0.82 percent in the 2024 election to the U.S. House.
Why are Big Apple voters demanding more parties than their institutions can supply?
Reasons include an increasingly competitive Republican Party, an active Conservative Party that endorses some Republicans and even Democrats, plus other cross-endorsement combinations with enough support to win a seat or two. Above all, the regular Democratic and Republican parties ran candidates in many parts of the city rather than just districts that seemed winnable in retrospect.
The map below gives a sense of the geography of voting.
It shows district-level vote shares for four groups of parties that win seats under various simulations (more on those in a moment).
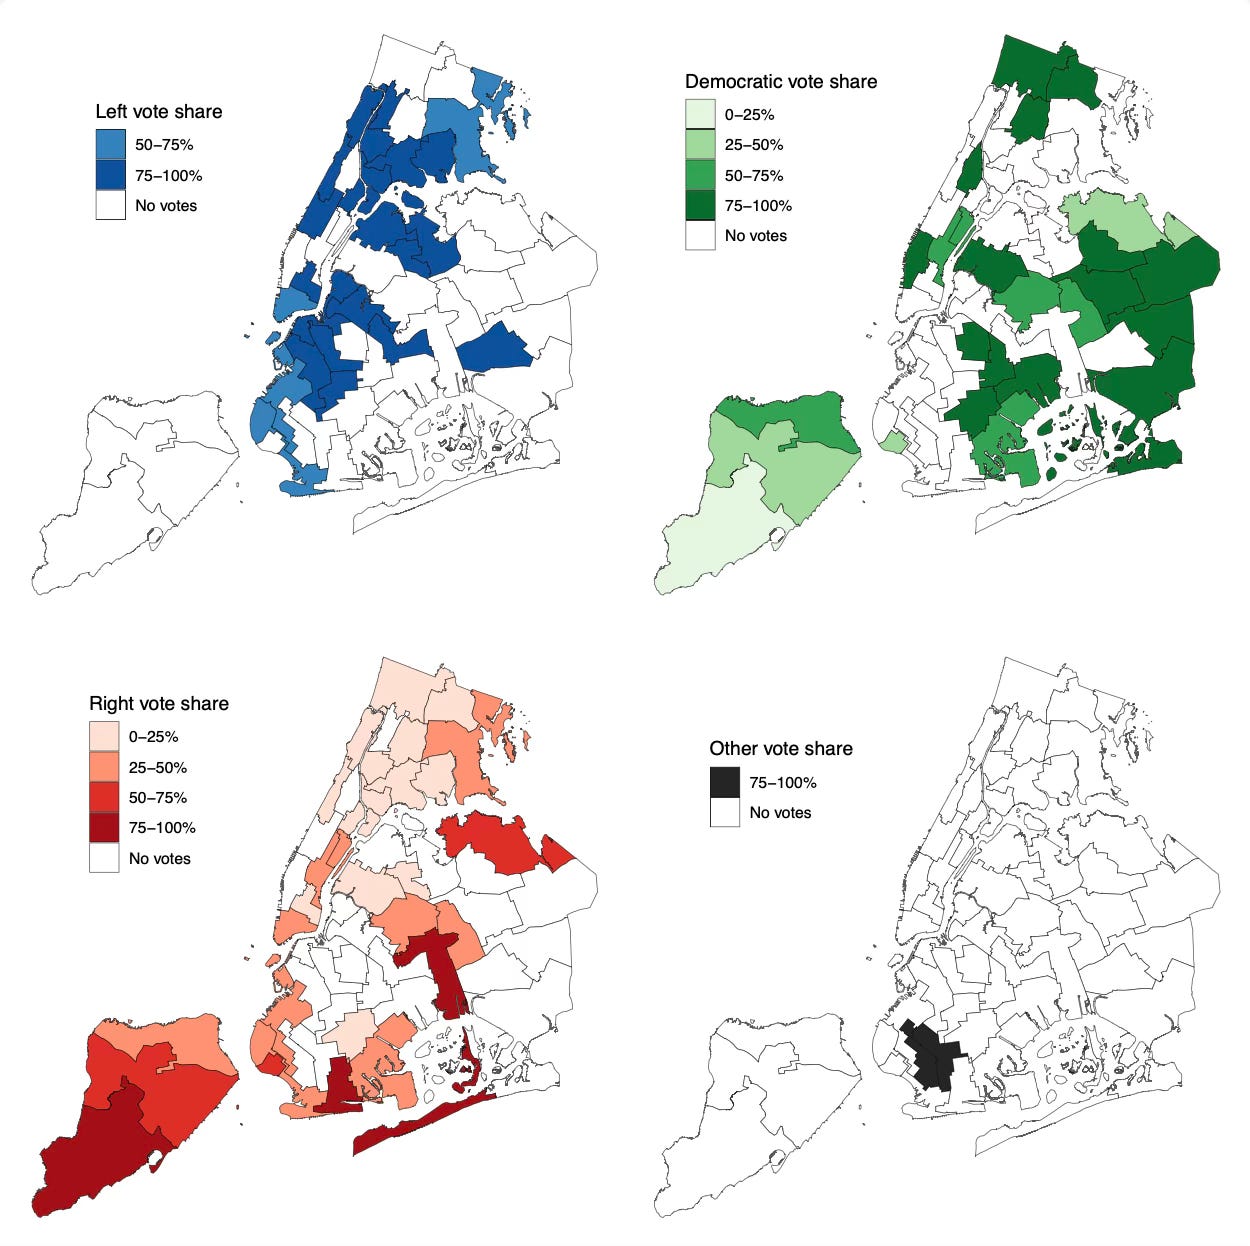
The left bloc comprises Democratic-Working Families endorsees and had the most geographically concentrated support. No candidate in this group got fewer than half of the votes.
The right bloc comprises Republican and Republican-Conservative candidates. This group earned the full range of votes in the districts where it ran. Support for regular Democrats similarly ran the full range.
“No votes” means that the respective party grouping did not have a candidate in the district.
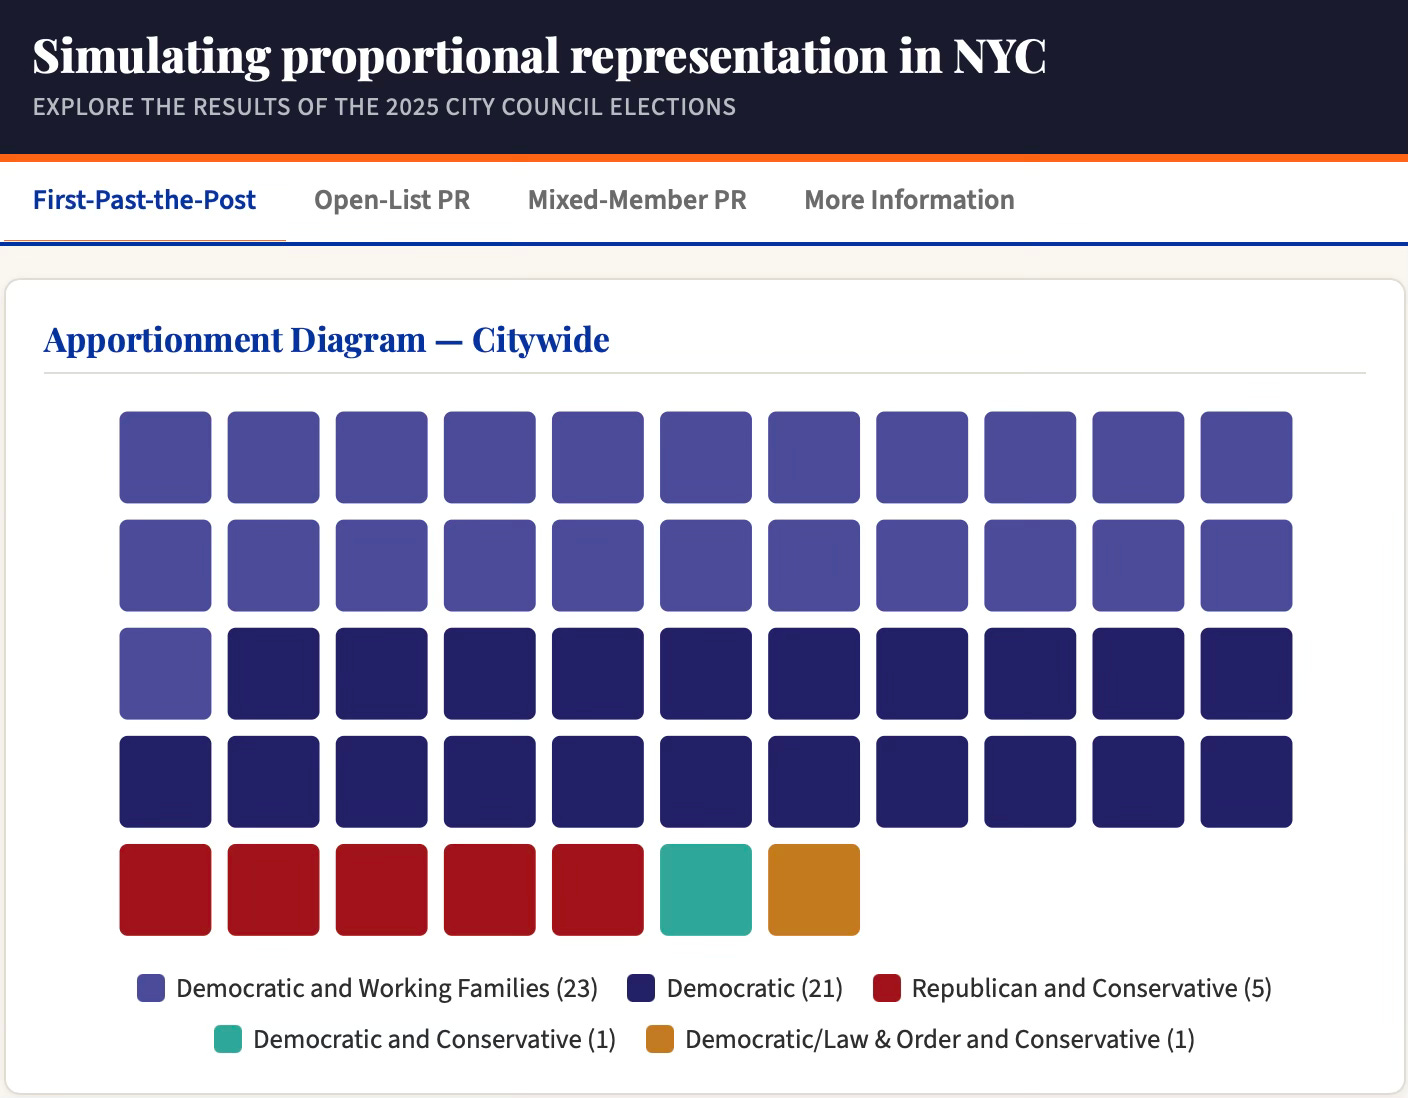
A new interactive website lets users explore results, individual winners, and the indices just described under different electoral systems.
The first tab covers first-past-the-post (FPTP) with a 51-seat council.
The second covers open-list proportional representation (PR) with borough-wide districts of many seats each. In that system, votes for candidates also count for their parties’ lists. Seats are allocated to lists in proportion to their shares of votes. Then these seats go to candidates in descending order of their vote totals.
A third simulation covers mixed-member PR (MMP) based on the existing map of 51 single-seat districts, plus 20 “compensation” seats allocated to parties on a citywide basis. Compensation seats are used to make parties’ seat shares as proportional as possible to their vote shares after accounting for seats already won in the district races. The website default is 20 compensation seats. A forthcoming Manhattan Institute issue brief explains these simulations in detail.
Users can toggle several features of each simulation. For both PR systems, they can choose between two rules for allocating seats to parties. One prioritizes larger parties, and the other aims for a tighter fit between votes and seats. On the MMP tab, users can toggle the number of compensation seats up to 50 (effectively doubling the size of the City Council) or down to zero (duplicating FPTP).
Here are a few interesting points from the simulations.
No configuration changes council control because that depends on how parties decide to organize the chamber. Rather, each PR model (and variant thereof) makes minor adjustments to the relative balance among parties. Both PR simulations bring regular Republicans into council: one under borough-wide OLPR, three under MMP with the 20-seat compensation tier. Switching to the more proportional allocation rule in OLPR gives regular Republicans two seats instead of one. Under FPTP, only Republicans with Conservative Party endorsements win seats. The Democratic and Democratic-Working Families parties are neck-and-neck across configurations. All parties trivially get more seats when council size expands.
As for indices, all PR systems unsurprisingly reduce the Gallagher index, and switching to the more proportional allocation rule does so even more. OLPR also increases the expected effective numbers of parties. This is because the average number of seats per district increases; recall that the SPM rests on this value, plus assembly size. MMP keeps the expectations lower because a substantial share of districts have just one seat each. However, the SPM for MMP is still experimental.
We are excited to share the simulation with the public. Again, it is impossible to say whether New York City’s new three-party system is temporary, and we look forward to reporting on the situation as it unfolds.
 | A guest post by
|
I ran a series of simulations a few months ago for a system combining SNTV + and MMP (I called it "Top-2 + Compensation" in my head). Basically, 17 three-seat districts where the top-two candidates are elected, and the third seat is given compensatorily based on city-wide party share (allocated among a party's unsuccessful candidates from highest to lowest votes, ignoring those who ran in districts where seats had all been already filled).
The results were promising: a proportional council for most realistic configurations of 2-4 parties, strongest candidates were consistently elected across a series of geographical distributions, representational parity remained across geography, no perverse incentives, independents with meaningfully constituencies could still be elected. The vast majority of districts ended up with the compensatory seat going to 3rd or 4th place, with the few exceptions being very important for overall proportionality.
I think it is unrealistic given weak parties unable to meaningfully gatekeep their ballot-line, but I was reminded of it given your post.